AI Agent Stack, Module 07: Integration, Every Layer in One Traced Answer
2026
Modules 01 to 06 each built one piece: an API, tools, RAG, an MCP server, a plugin and a skill. This last module wires them into one agent and answers one question with all of them. Every step is timed and recorded in agent-debugger, so you can see exactly what ran, with what input, and for how long. And if the agent wants to email the result, it stops and waits for you.
In the AI Agent Stack overview, I compared the six building blocks people mix up: APIs, tools, RAG, MCP, plugins and skills. Module 01 set up the issue tracker API, and Module 06 added the triage skill. This post puts everything together: github.com/likarajo/ai-agent-stack/tree/main/07-integration.
The trace comes from agent-debugger, the small open-source console I wrote about in Breakpoints for AI Agents: Pause Before email.send.
Watch the video
1. What it is
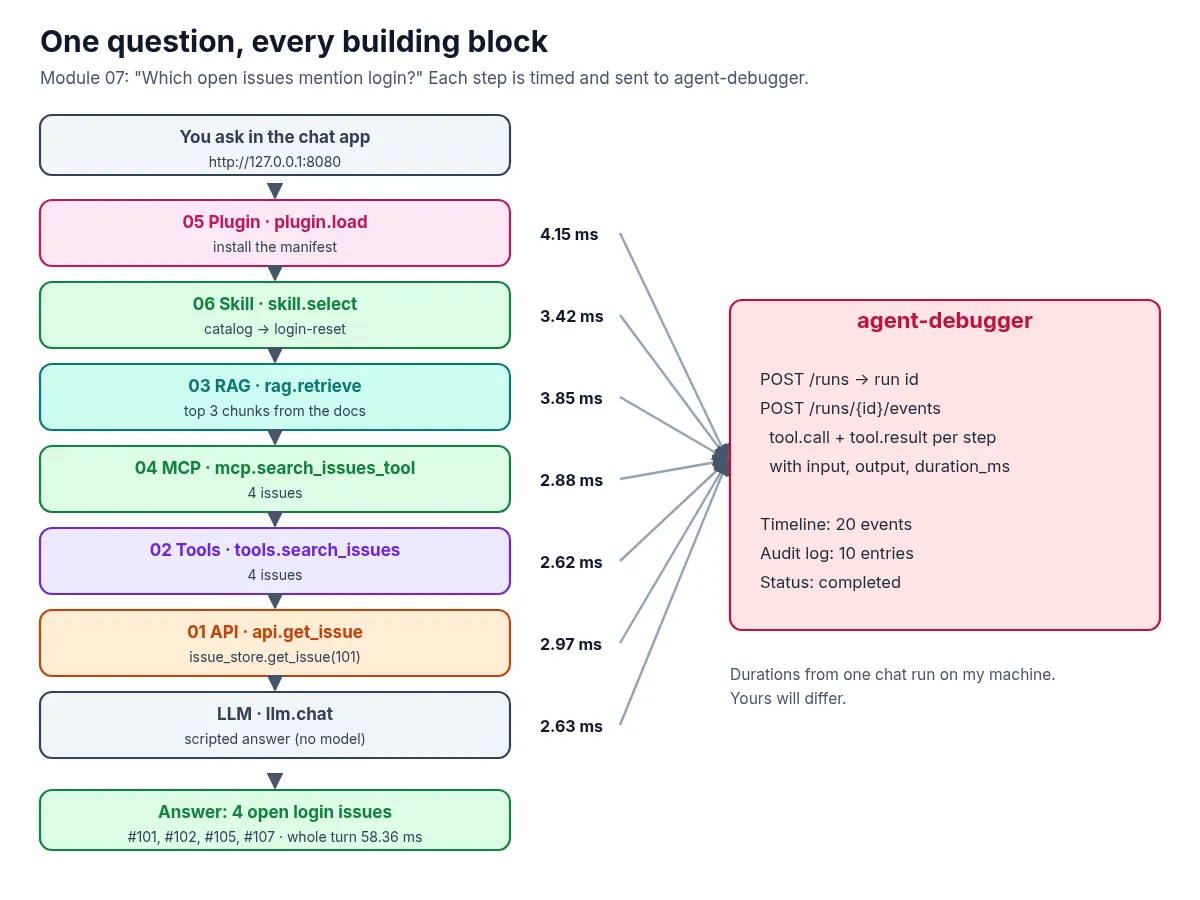
Module 07 is one function, answer_question(), with two front ends: a small web chat and a command-line script. For every question it runs the same seven steps, in this order:
| Step | What it does |
|---|---|
plugin.load (Module 05) |
Installs the northwind-issue-tracker plugin manifest |
skill.select (Module 06) |
Reads the skill catalog and picks the matching skill (login-reset for the two login questions, issue-triage for the triage task) |
rag.retrieve (Module 03) |
Pulls the top 3 chunks from the team’s docs |
mcp.search_issues_tool (Module 04) |
Searches open issues through the MCP server’s tool |
tools.search_issues (Module 02) |
Runs the same search as a plain function tool |
api.get_issue (Module 01) |
Fetches the top issue’s details |
llm.chat |
Writes the answer from everything above |
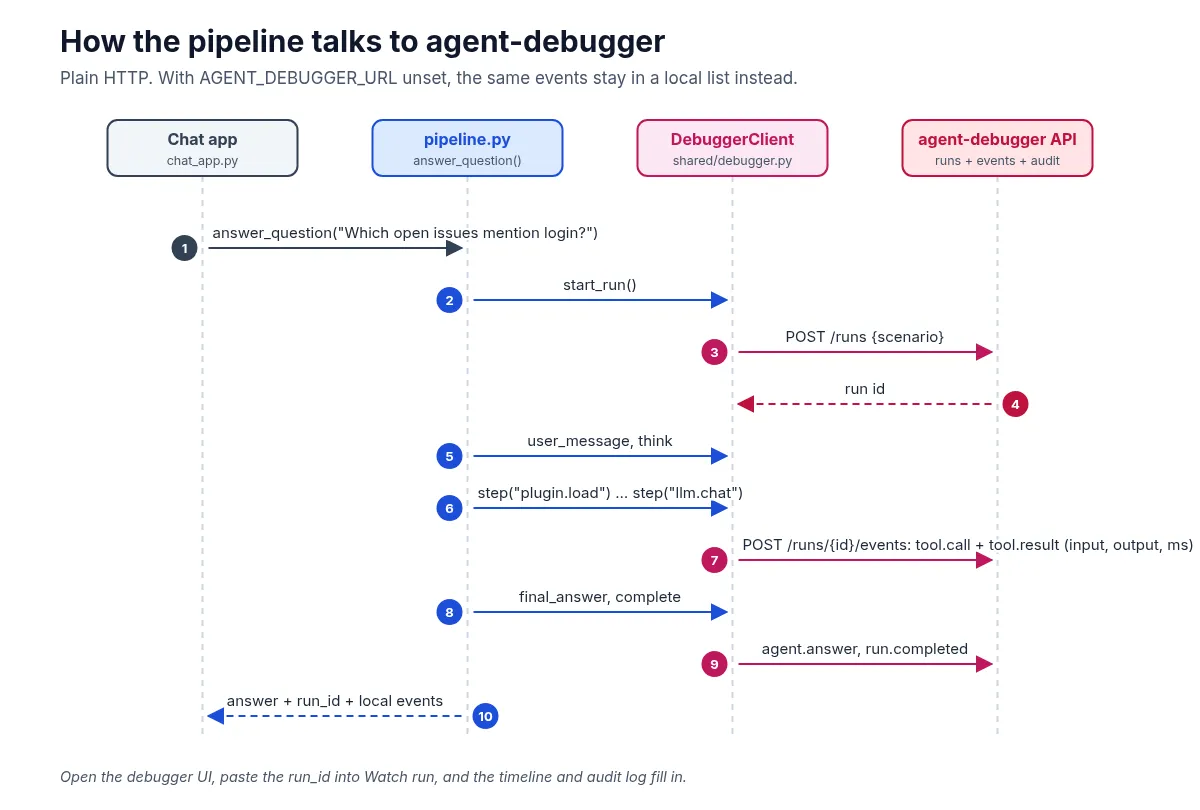
Each step is wrapped in a small debugger client that sends a tool.call event when the step starts and a tool.result event, with its input, output and duration_ms, when it ends. With AGENT_DEBUGGER_URL set, those events go to agent-debugger over HTTP. Without it, they stay in a local list that the chat app shows in its sidebar.
2. Why it matters
Each earlier module was easy to reason about on its own. Put six of them behind one answer and the questions change: which step found the issue ids? Which docs did the answer cite? Was the slow part retrieval or the model? Did the agent try to do anything with side effects?
You can’t answer those from the final text. You need a record of every step, in order, with inputs, outputs and timings. That’s what the debugger gives you here. And for the one step that reaches the outside world, sending an email, a record after the fact isn’t enough, so the run stops and waits for a person.
That gives the rule of thumb for this module: if you can’t see every step, you can’t trust the answer. Log every step, and gate the ones you can’t take back.
3. The running example
The chat app offers three demo questions as chips:
- “Which open issues mention login?” The main example in this post.
- “How do we usually fix login timeouts?” Leans on RAG and the runbook.
- “Triage the open login issues.” Uses the skill’s report format, and is the one to try with email.
All three run the full set of seven steps. The data is the same Northwind sample data as every earlier module: the issue store, the three docs and the three skills from Module 06.
4. Set it up
You need Python 3.11 or newer and git. For the debugger you also need Docker. There’s no model and there are no API keys.
Clone the repo and create a virtual environment from the repo root (you can reuse the clone from the earlier modules):
git clone https://github.com/likarajo/ai-agent-stack.git
cd ai-agent-stack
python3 -m venv .venv
source .venv/bin/activate
pip install -r 07-integration/requirements.txt
This module needs the dependencies of the modules it calls, so the list is longer than before: FastAPI, Uvicorn, httpx, NumPy, the MCP Python SDK, PyYAML and pytest. Run everything from the repo root.
Then, in a second terminal, start Agent Debugger from the same repo root (needs Docker; clones the debugger into third_party/ if needed):
make debugger-upThat starts the debugger console on http://localhost:3000, its API on http://localhost:8000, and this repo’s issue-api remapped to host http://localhost:8001 so it does not collide with the debugger API. (You can also docker compose up --build inside a clone of agent-debugger for the same :3000 / :8000 ports without the stack’s issue-api.)
5. Run it
Back in the ai-agent-stack terminal, start the chat app and point it at the debugger API:
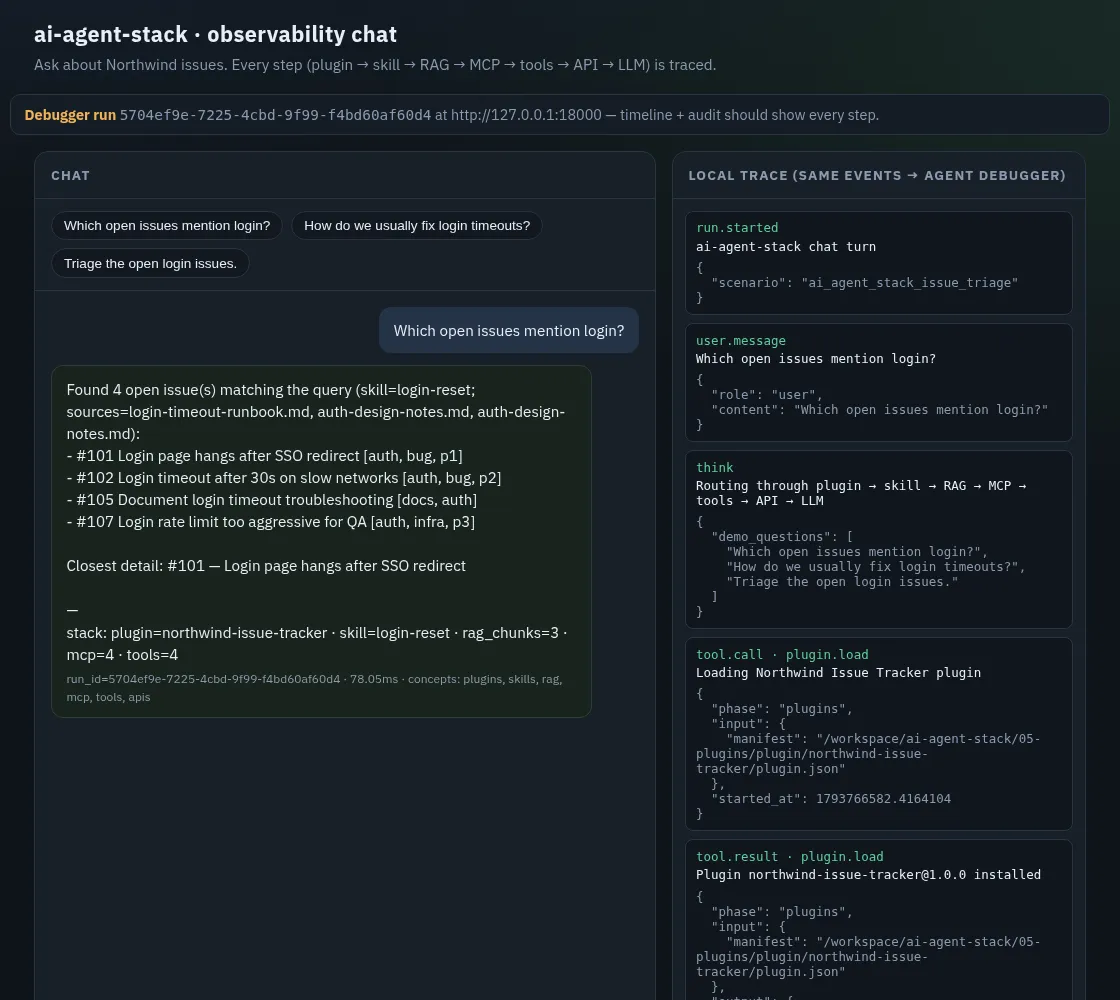
AGENT_DEBUGGER_URL=http://127.0.0.1:8000 SKIP_MODEL=1 make chatOpen http://127.0.0.1:8080 and click “Which open issues mention login?”. The answer appears in the main pane, and the sidebar shows the local trace with each step and its duration:
The answer:
Found 4 open issue(s) matching the query (skill=login-reset; sources=login-timeout-runbook.md, auth-design-notes.md, auth-design-notes.md):
- #101 Login page hangs after SSO redirect [auth, bug, p1]
- #102 Login timeout after 30s on slow networks [auth, bug, p2]
- #105 Document login timeout troubleshooting [docs, auth]
- #107 Login rate limit too aggressive for QA [auth, infra, p3]

Closest detail: #101 — Login page hangs after SSO redirect

—
stack: plugin=northwind-issue-tracker · skill=login-reset · rag_chunks=3 · mcp=4 · tools=4
The same four issues as every earlier module. The last line tells you which piece contributed what.
The chat app also shows the run id. Open http://localhost:3000, paste the run id into the field next to Watch run, and the debugger fills in the timeline and the audit log:
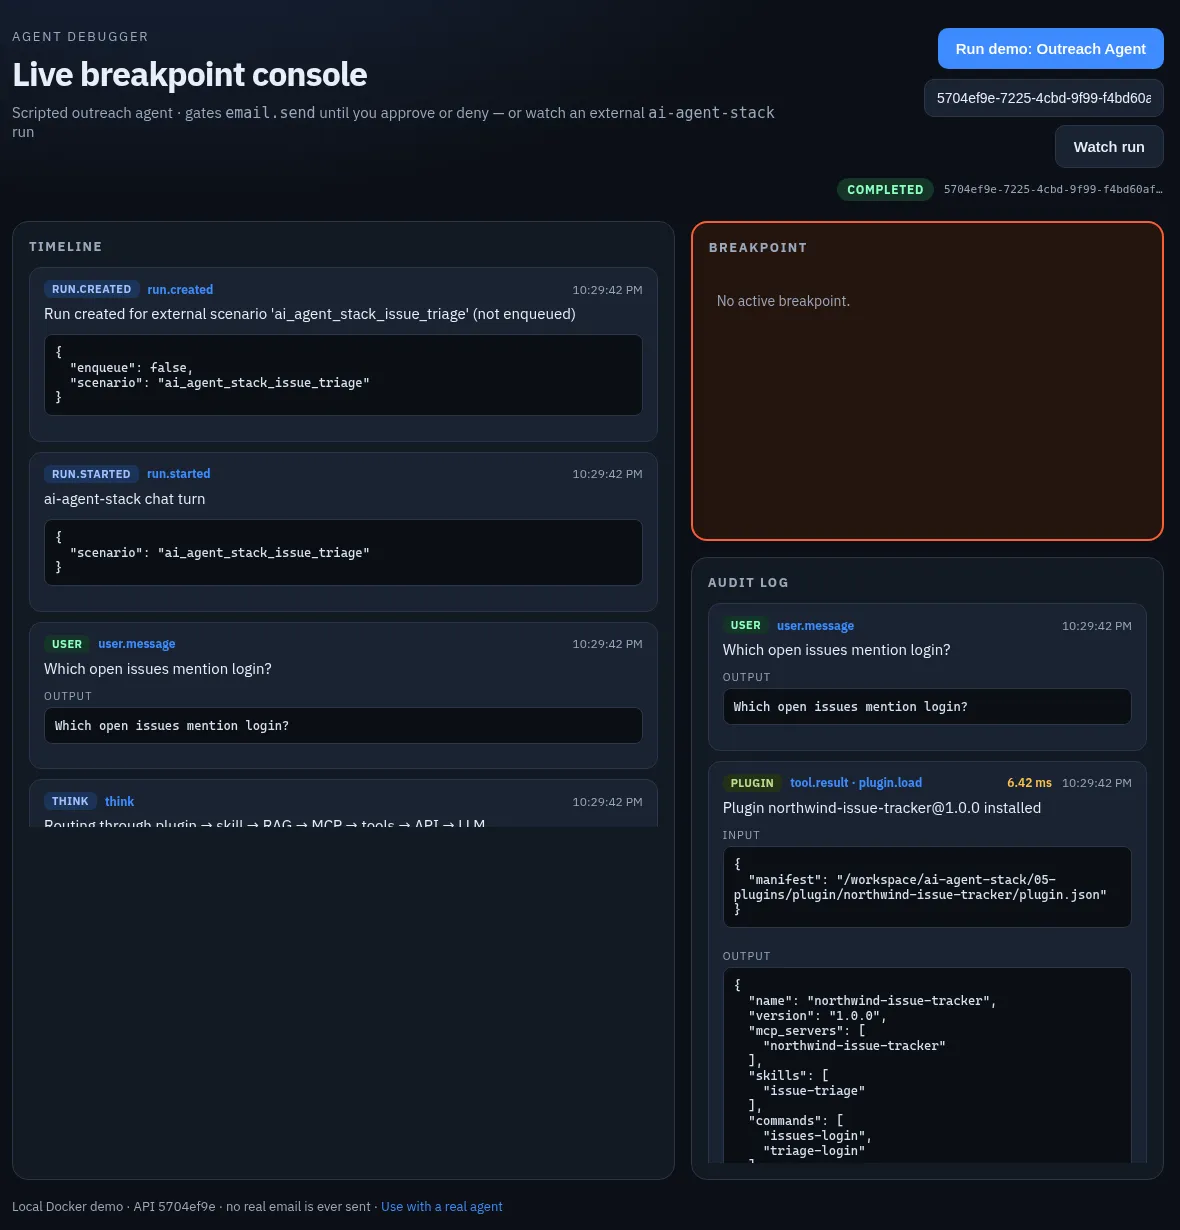
For that one question, the debugger recorded 20 events. The audit log keeps 10 of them: the user message, the seven tool.result entries, the final answer and run.completed. Here are the step timings from that run:
| Audit entry | Duration |
|---|---|
plugin.load |
4.15 ms |
skill.select |
3.42 ms |
rag.retrieve |
3.85 ms |
mcp.search_issues_tool |
2.88 ms |
tools.search_issues |
2.62 ms |
api.get_issue |
2.97 ms |
llm.chat |
2.63 ms |
| Whole turn | 58.36 ms |
Your timings will differ. They’re also not the whole story: on a fresh command-line run, the whole turn took 566.45 ms while the seven steps added up to about 41 ms. Most of the gap, about 430 ms, sat between the RAG result and the MCP call. That’s Python importing the MCP SDK and server code, which happens before the MCP step’s timer starts. The trace made that visible; the step durations alone would have hidden it.
You can do the same from the command line, without the chat app:
AGENT_DEBUGGER_URL=http://127.0.0.1:8000 SKIP_MODEL=1 python 07-integration/integration/pipeline.py --question "Which open issues mention login?"It prints the same answer, followed by the run id and the total duration.
The email gate
Now ask for something with a side effect. Either add --email on the command line, or put “email” or “notify” in the question:
AGENT_DEBUGGER_URL=http://127.0.0.1:8000 SKIP_MODEL=1 python 07-integration/integration/pipeline.py --question "Triage the open login issues." --emailAfter the seven steps and the triage report, the agent calls email.send. agent-debugger has email.send on its list of gated tools, so the run pauses and the script waits:
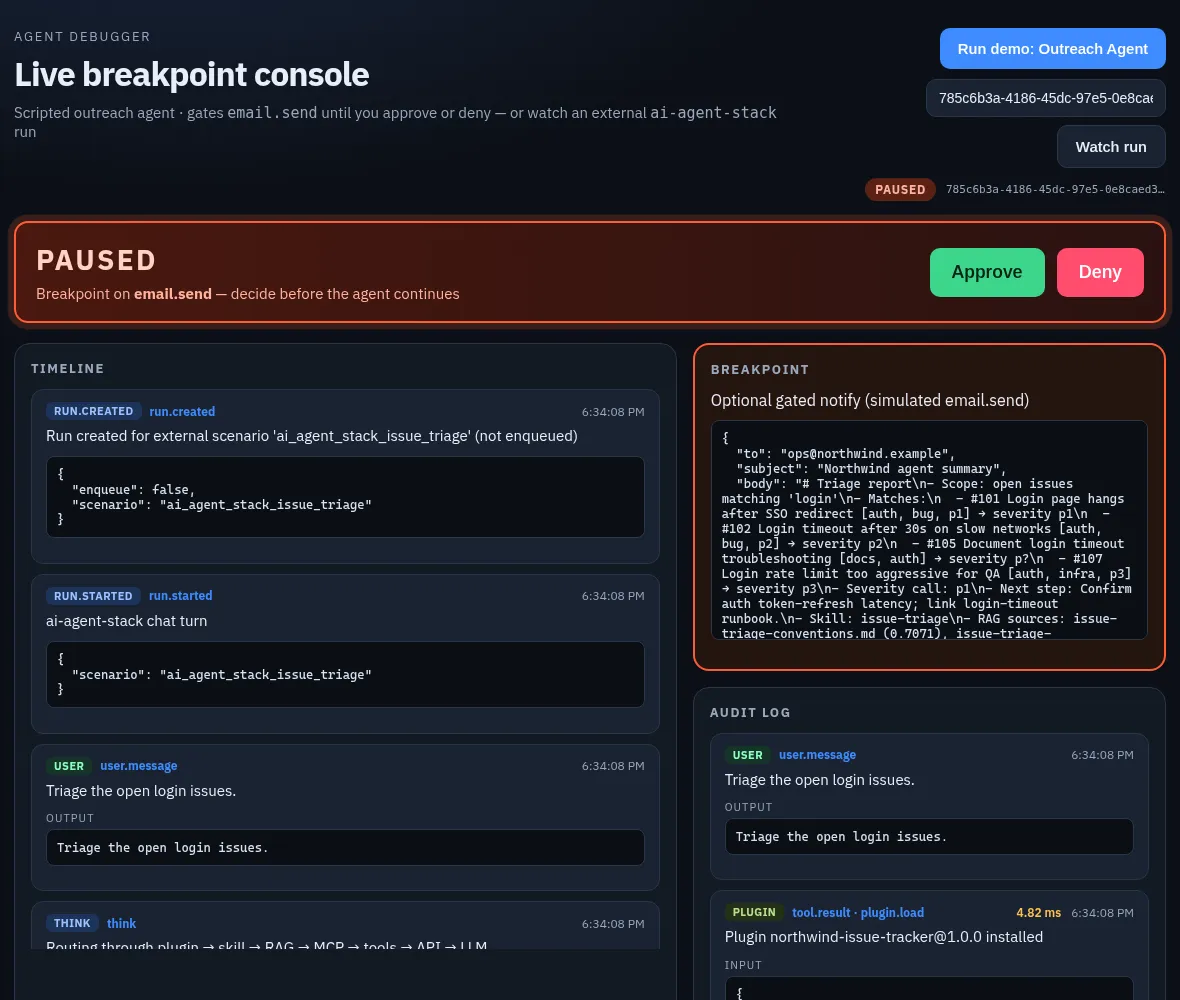
The payload is right there: who it would go to, the subject and the full body. Then you decide:
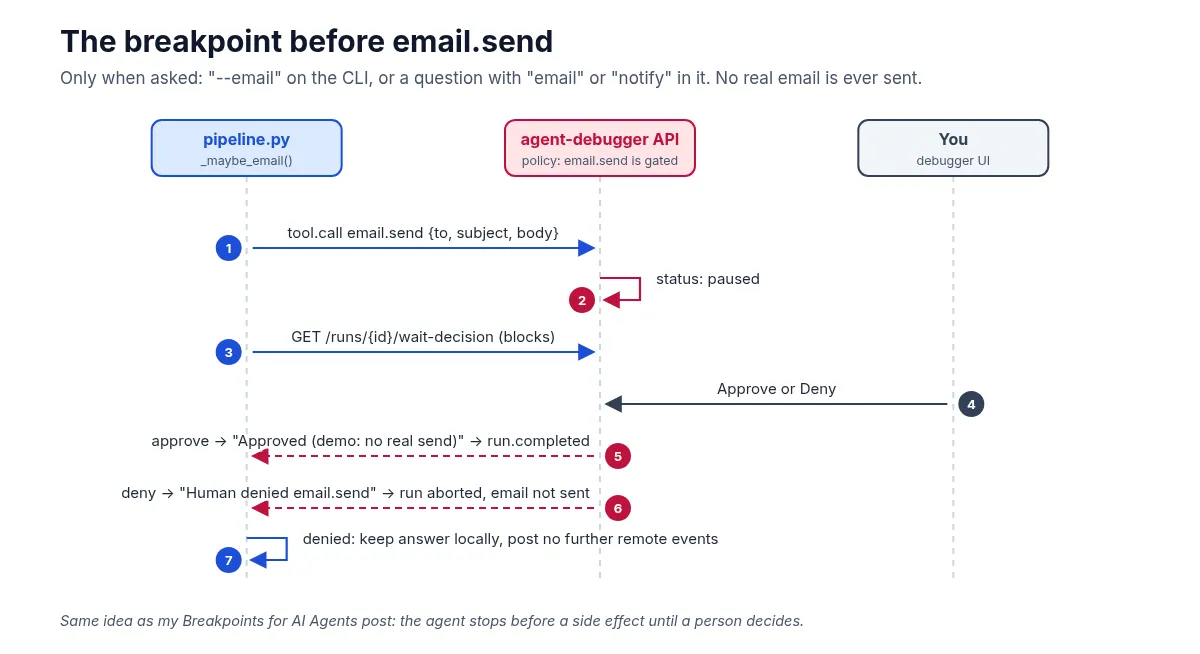
- Approve. The debugger records
Human approved email.sendandApproved — tool allowed to proceed (demo: no real send), the script prints the triage report, and the run ends withrun.completed. - Deny. The debugger records
Human denied email.send(the decision value isdenied; legacydenydis still accepted) andRun aborted after deny — email was not sent, aborts the remote run, and the pipeline finishes locally: it keeps the triage answer, appends(email.send denied — answer not emailed), and does not POST any further events to the already-aborted run (a secondrun.abortedwould be HTTP 400).
Either way, no email goes out. The “send” is a function, simulate_email_send, that only returns a note saying nothing was sent. The point is the pause and the record, not the email.
6. How it works inside
There are three files to read, in this order:
-
shared/debugger.pyis the debugger client. Itsstep()context manager is what makes every step show up with a timing:started = time.perf_counter() call = self.emit("tool.call", tool=tool, message=message, payload=call_payload) bag = {"call": call, "output": None, "message": None} try: yield bag finally: duration_ms = round((time.perf_counter() - started) * 1000, 2) ... self.emit("tool.result", tool=tool, message=..., payload=result_payload)emit()posts to/runs/{id}/eventswhenAGENT_DEBUGGER_URLis set, and appends tolocal_eventseither way. For a gated tool likeemail.send,tool_call()posts the event and then blocks onGET /runs/{id}/wait-decisionuntil you decide. On Deny it records a local deniedtool.resultand marks the remote run closed so later emits stay local-only. -
07-integration/integration/pipeline.pyhasanswer_question(), which calls the seven steps in order. Each one is a few lines insidewith dbg.step(...). Two of them take a shortcut worth knowing about: the MCP step imports the server’ssearch_issues_toolfunction and calls it directly instead of starting the server over stdio as Module 04 did, and the API step reads from the shared issue store instead of making an HTTP request to the Module 01 server. Both keep the demo self-contained; the trace still records them as the MCP and API steps. After a Deny onemail.send, the pipeline returns without callingfinal_answer/completeon the remote debugger. -
07-integration/integration/chat_app.pyis the web chat: a FastAPI app withPOST /api/chat, which callsanswer_question()and returns the answer, the run id and the local events for the sidebar.
About the LLM step: with SKIP_MODEL=1, which every command in this post uses, llm.chat composes the answer from a template instead of calling a model, and its tool.result says so: “Scripted answer composed (no live model)”. The step still records the configured model name (qwen2.5:0.5b, the local Ollama default), so don’t read that as proof a model ran. Without SKIP_MODEL, the pipeline uses a local Ollama model if one is available. I only ran the scripted path for this post.
7. Test it
The tests don’t need a model or the debugger:
PYTHONPATH=.:07-integration:05-plugins:06-skills:04-mcp:03-rag:02-tools \
  pytest 07-integration/tests -q -rA
............ [100%]
=========================== short test summary info ============================
PASSED 07-integration/tests/test_chat_app.py::test_health_and_demo_questions
PASSED 07-integration/tests/test_chat_app.py::test_chat_returns_answer_and_events
PASSED 07-integration/tests/test_chat_app.py::test_index_html
PASSED 07-integration/tests/test_debugger_adapter.py::test_debugger_emits_and_gates_email
PASSED 07-integration/tests/test_debugger_adapter.py::test_deny_path_ends_cleanly_without_posting_after_abort
PASSED 07-integration/tests/test_debugger_adapter.py::test_full_answer_trace_posted_to_fake_debugger
PASSED 07-integration/tests/test_integration_smoke.py::test_gated_tools_match_debugger_policy
PASSED 07-integration/tests/test_integration_smoke.py::test_demo_questions_cover_stack_narration
PASSED 07-integration/tests/test_integration_smoke.py::test_build_report
PASSED 07-integration/tests/test_integration_smoke.py::test_pipeline_standalone_no_email
PASSED 07-integration/tests/test_integration_smoke.py::test_answer_emits_ordered_local_trace
PASSED 07-integration/tests/test_integration_smoke.py::test_debugger_client_noop_without_url(-q -rA is the quiet progress plus short pass summary the module README uses. Pass lines may vary slightly by pytest version.)
The 12 tests check that the gated tools match agent-debugger’s policy, that the chat app’s endpoints answer, that a full model-free run records all seven steps with a duration for each, that the debugger client sends the trace (including an approved email.send) to a fake debugger API, and that Deny ends cleanly without posting events after the remote abort.
What’s next
That’s the whole stack: an API, tools, RAG, MCP, a plugin and a skill, working together on one question, with every step on the record and a person in the loop before anything leaves the machine. From here, the most useful next step is to swap in your own pieces, your own API, docs or skill, and keep the trace on while you do.
If you only take one idea from this series, take the one from Breakpoints for AI Agents: let the agent run the steps you can undo, and make it stop before the ones you can’t.
Code: github.com/likarajo/ai-agent-stack/tree/main/07-integration