Twitter Sentiment Analysis
Report
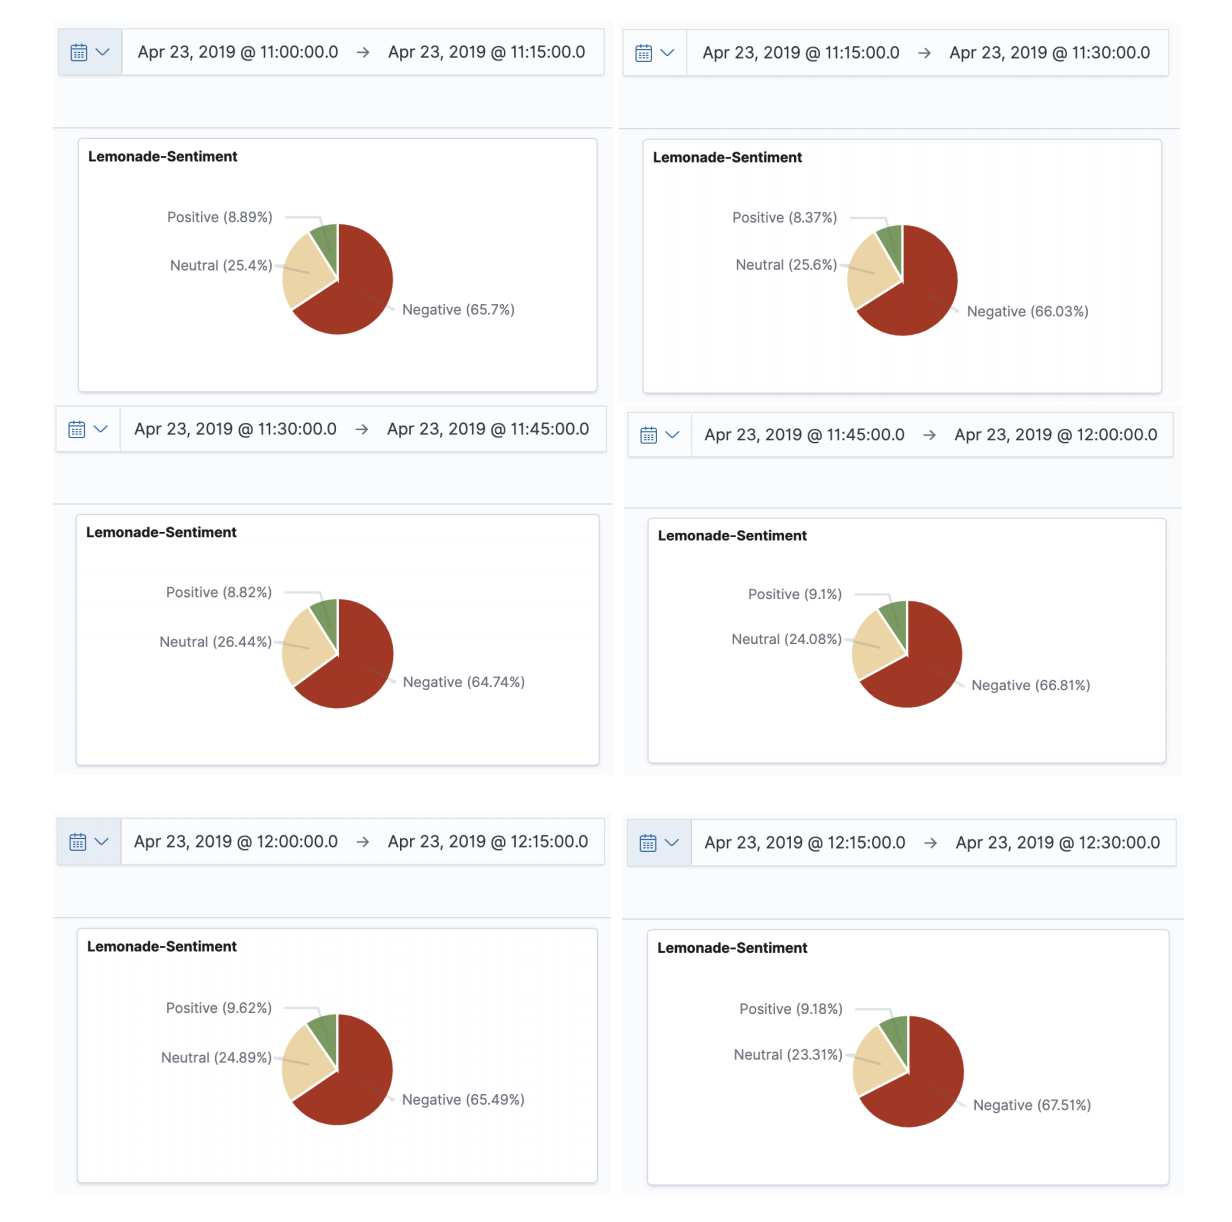
Sentiment analysis of tweets on “lemonade”
Sentiment analysis of tweets on “Fauci”
Components
1) Zookeeper: Administrator
- Open a new Terminal, get into the KAFKA Home directory
- Run
$ bin/zookeeper-server-start.sh config/zookeeper.properties
2) Kafka: Broker
- Open a new Terminal, get into the KAFKA Home directory
- Run
$ bin/kafka-server-start.sh config/server.properties(Kafka runs in localhost:9092)
3) Elastic Search: Distributed, RESTful search and analytics
- Open a new Terminal, get into the ELASTICSEARCH Home directory
- Run
$ bin/elasticsearch
4) Logstash: Ingest, transform, enrich, and output
- Open a new Terminal, get into LOGSTASH Home directory
- Create a file logstash-simple.conf with following content:
input { kafka { bootstrap_servers => "localhost:9092" topics => ["lemonade"] } } output { elasticsearch { hosts => ["localhost:9200"] index => "lemonade-index" } } - Run
$ bin/logstash -f logstash-simple.conf
5) Create Scala program jar
- Build
$ sbt > assembly - Run using arguments
$ spark-submit --class TopicSentiment <PathToJarFile>
  <kafka server and port>
  <topic>
  <consumer key>
  <consumer secret>
  <access token>
  <access token secret>
  lemonade
6) Kibana: Visualize your data. Navigate the Stack
- Open a new Terminal, get into the KIBANA Home directory
- Run
$ bin/kibana - Goto http://localhost:5601 in web browser
- Search for the appropriate topic index: lemonade-index
- Create personal dashboard
References
The R script has to be run within R Studio
Steps to run: - 1) Open R studion 2) Create a new project 3) Import the main.R file 4) Run the script line by line 5) Get the outputs in the Console or in Plots